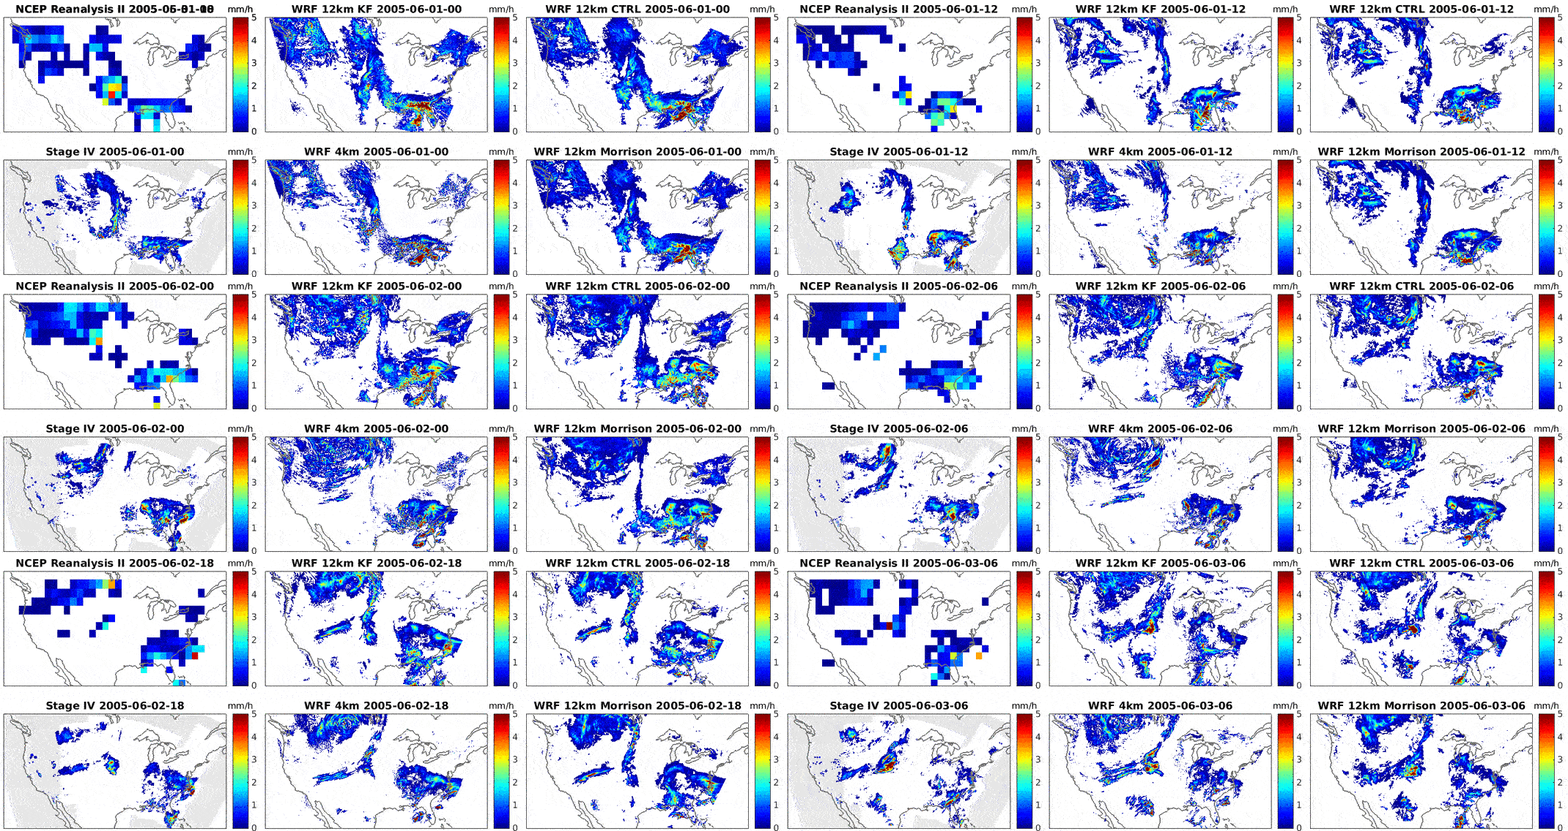
Climate simulations generally produce rainfall that is too diffuse and weak. New regional simulations at 4 km create more realistic events. (Chang et al 2018)
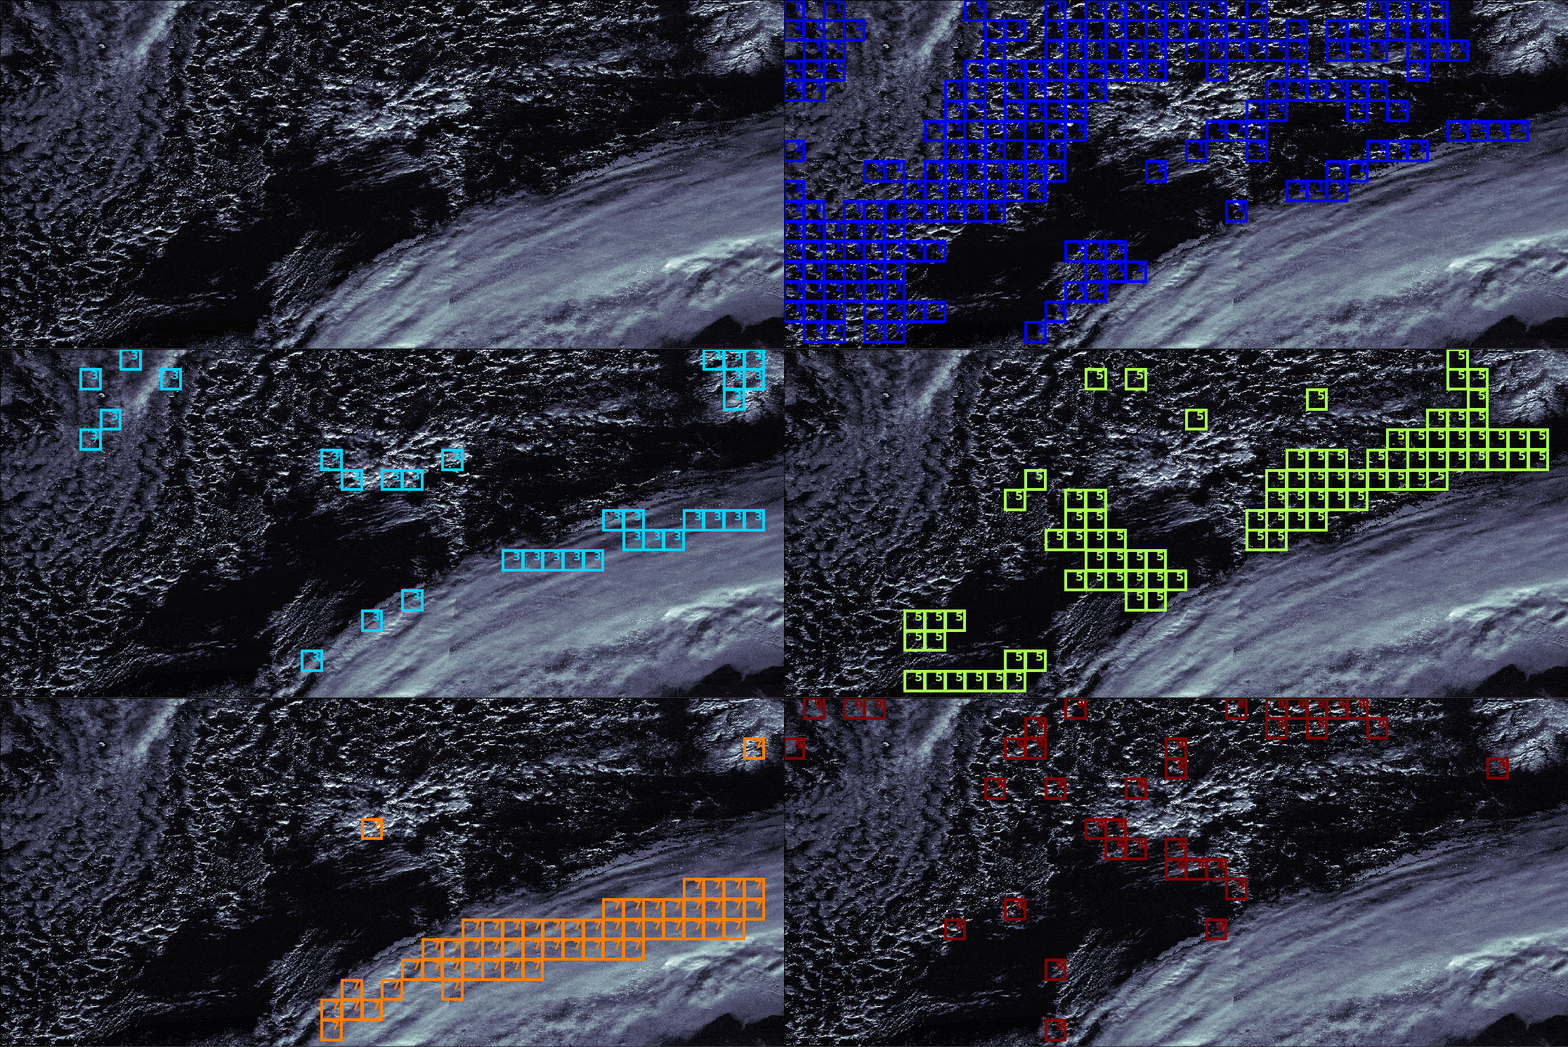
Potential changes in clouds are the largest uncertainty in projections of future climate. New approaches for unsupervised classification let satellite observations better inform climate science. (Kurihana et al., 2022)
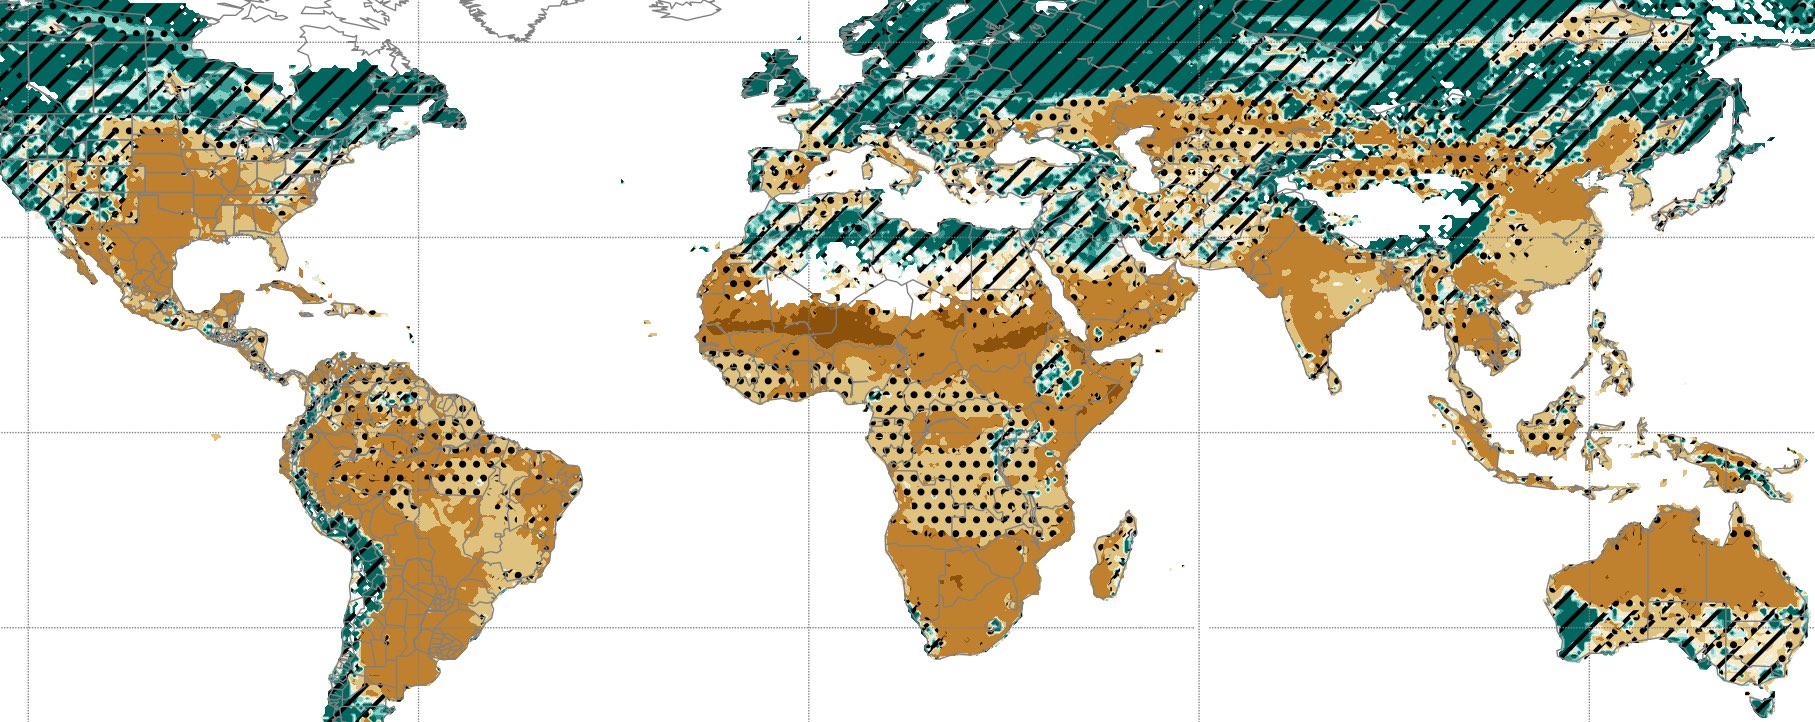
A new collaborative effort by 12 modeling groups disentangles agricultural yield responses to four different factors: temperature, rainfall, nitrogen application, and CO2. (Franke et al., 2019)
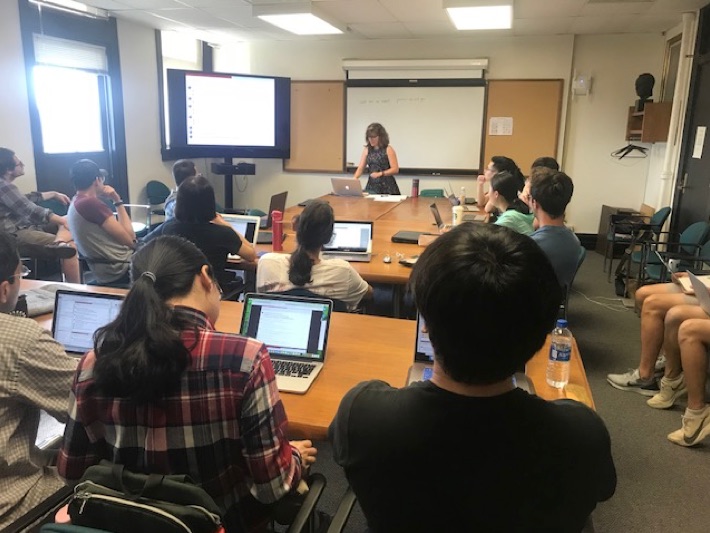
A new program at UChicago supports PhD and MS students in data-driven environmental research. September boot camps provide skills training in programming and statistical analysis.
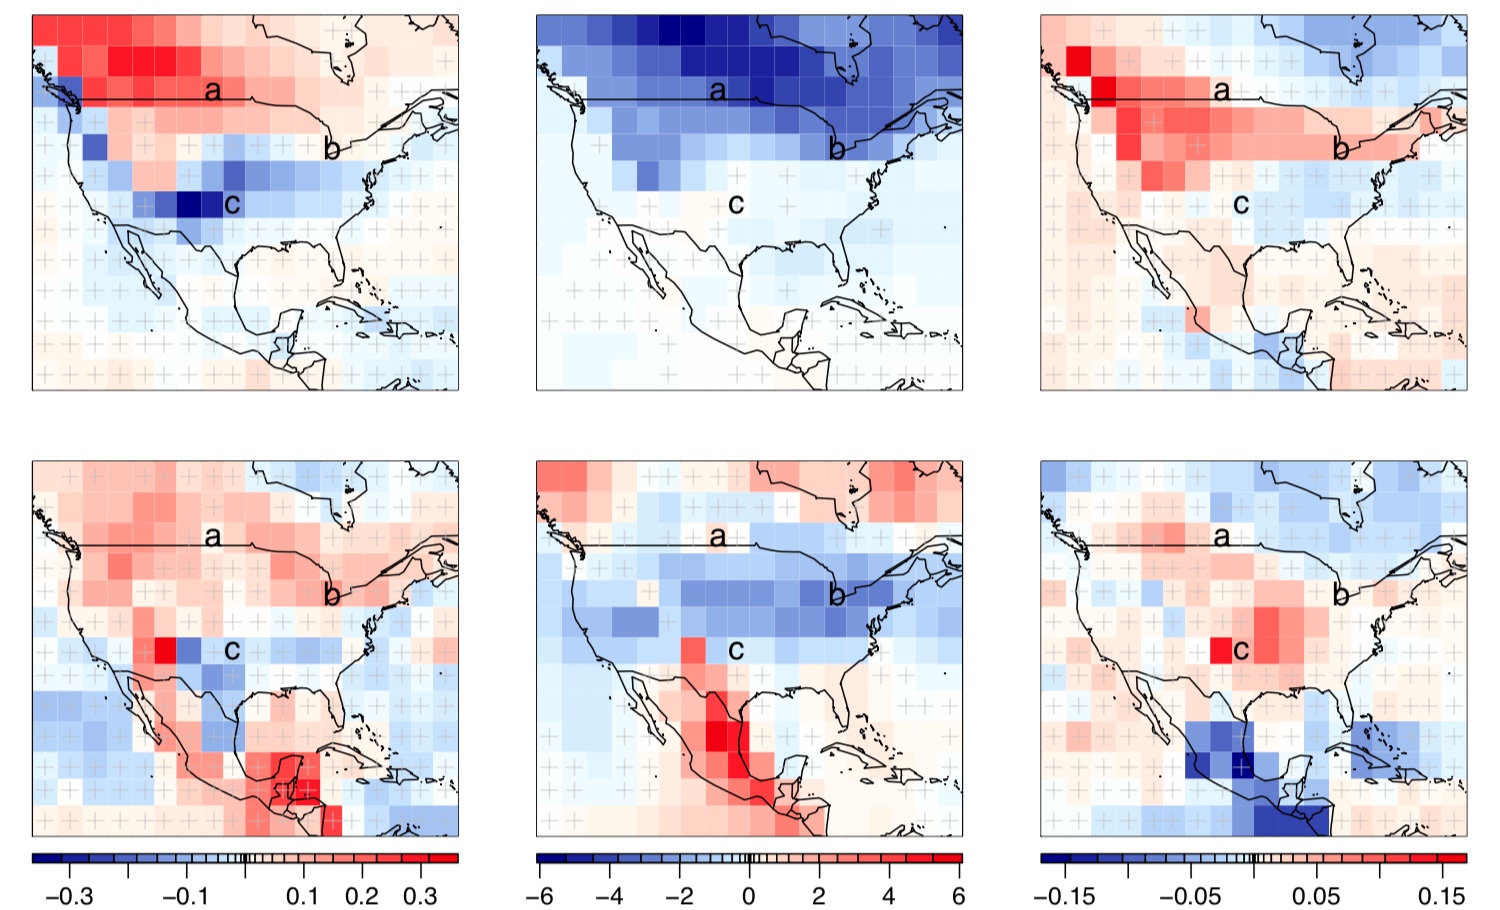
New methods based on ensembles of climate model output allow examining changes in entire temperature distributions, including extremes. In the N. midlatitudes, wintertime distributions narrow by 2100. (Haugen et al 2018)
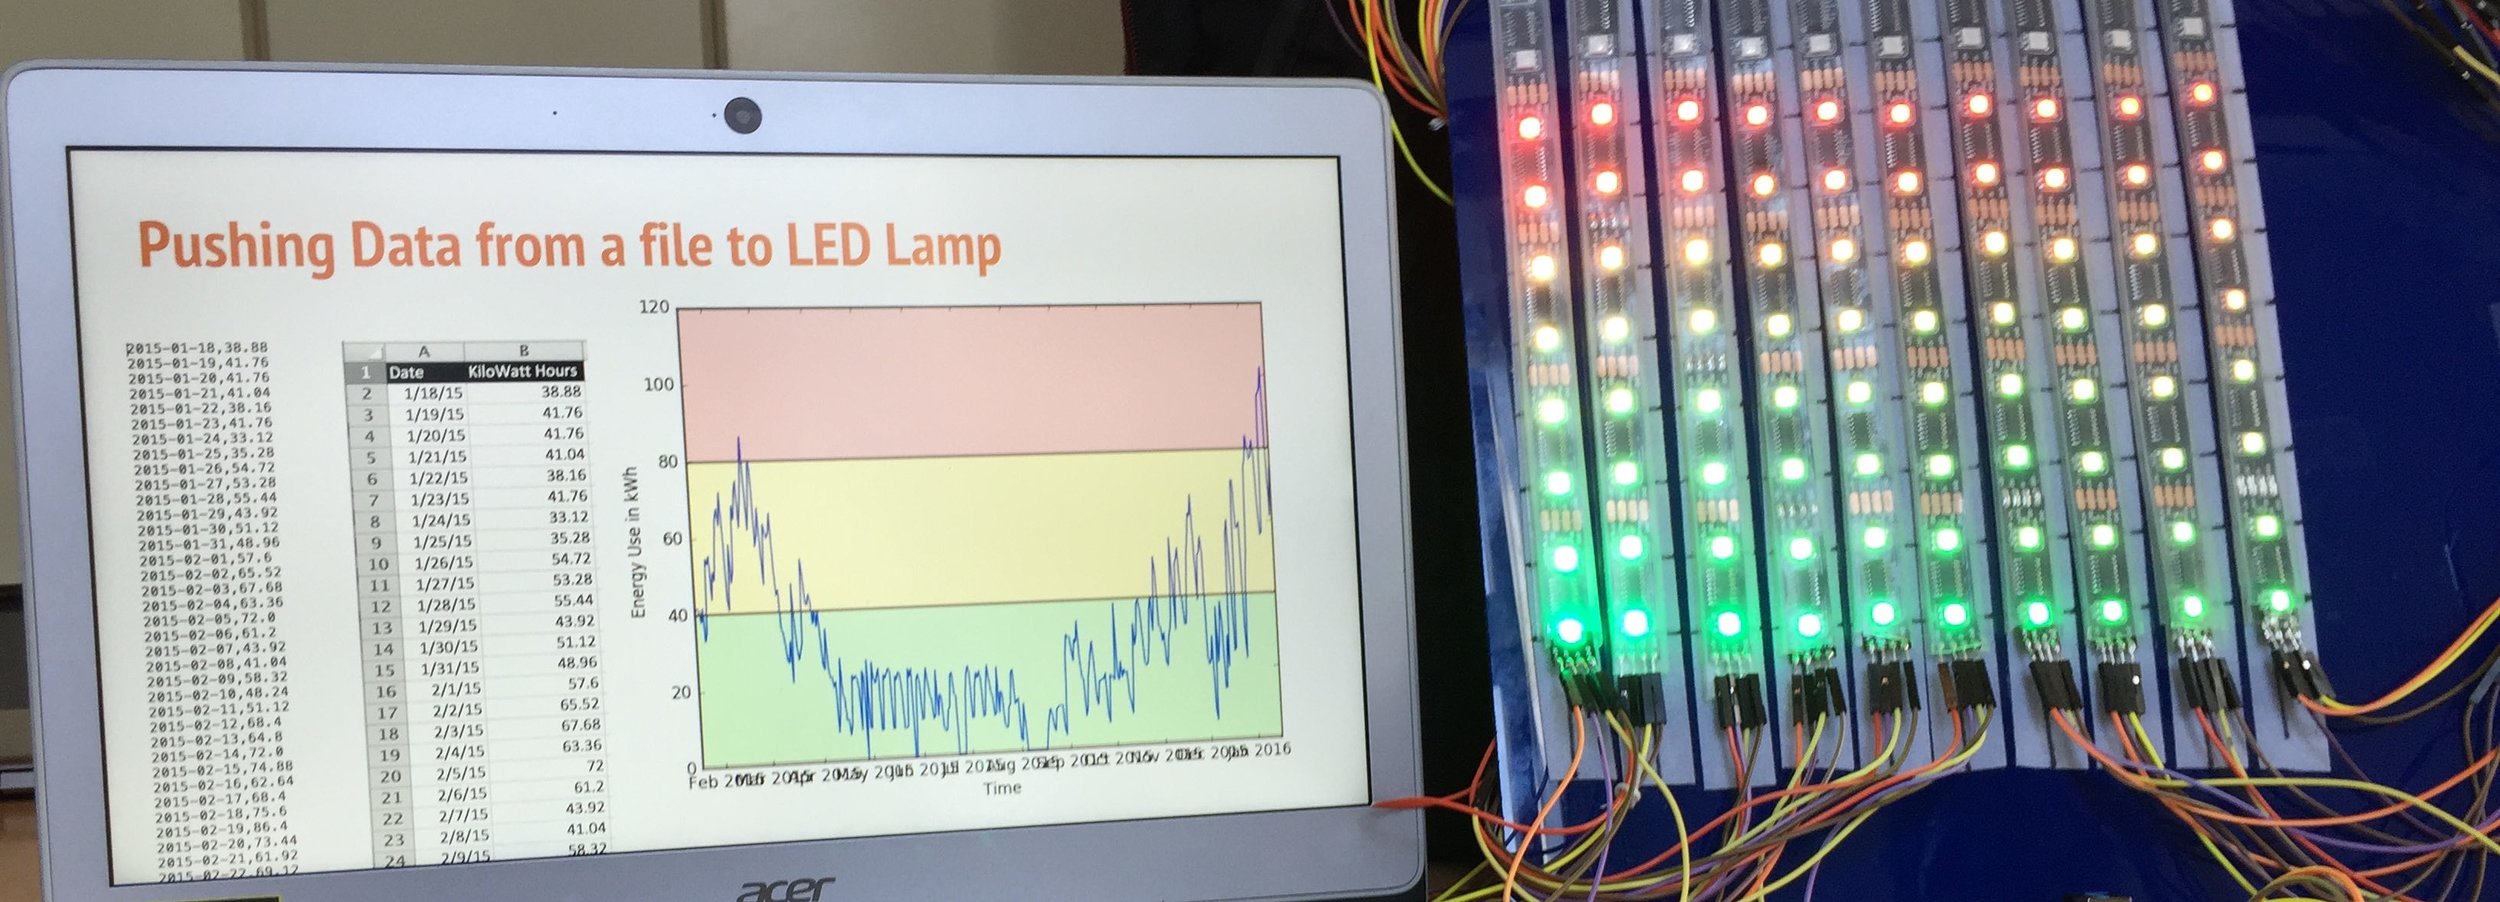
Hands-on Interactive Curriculum for Middle through High School Students and Teachers
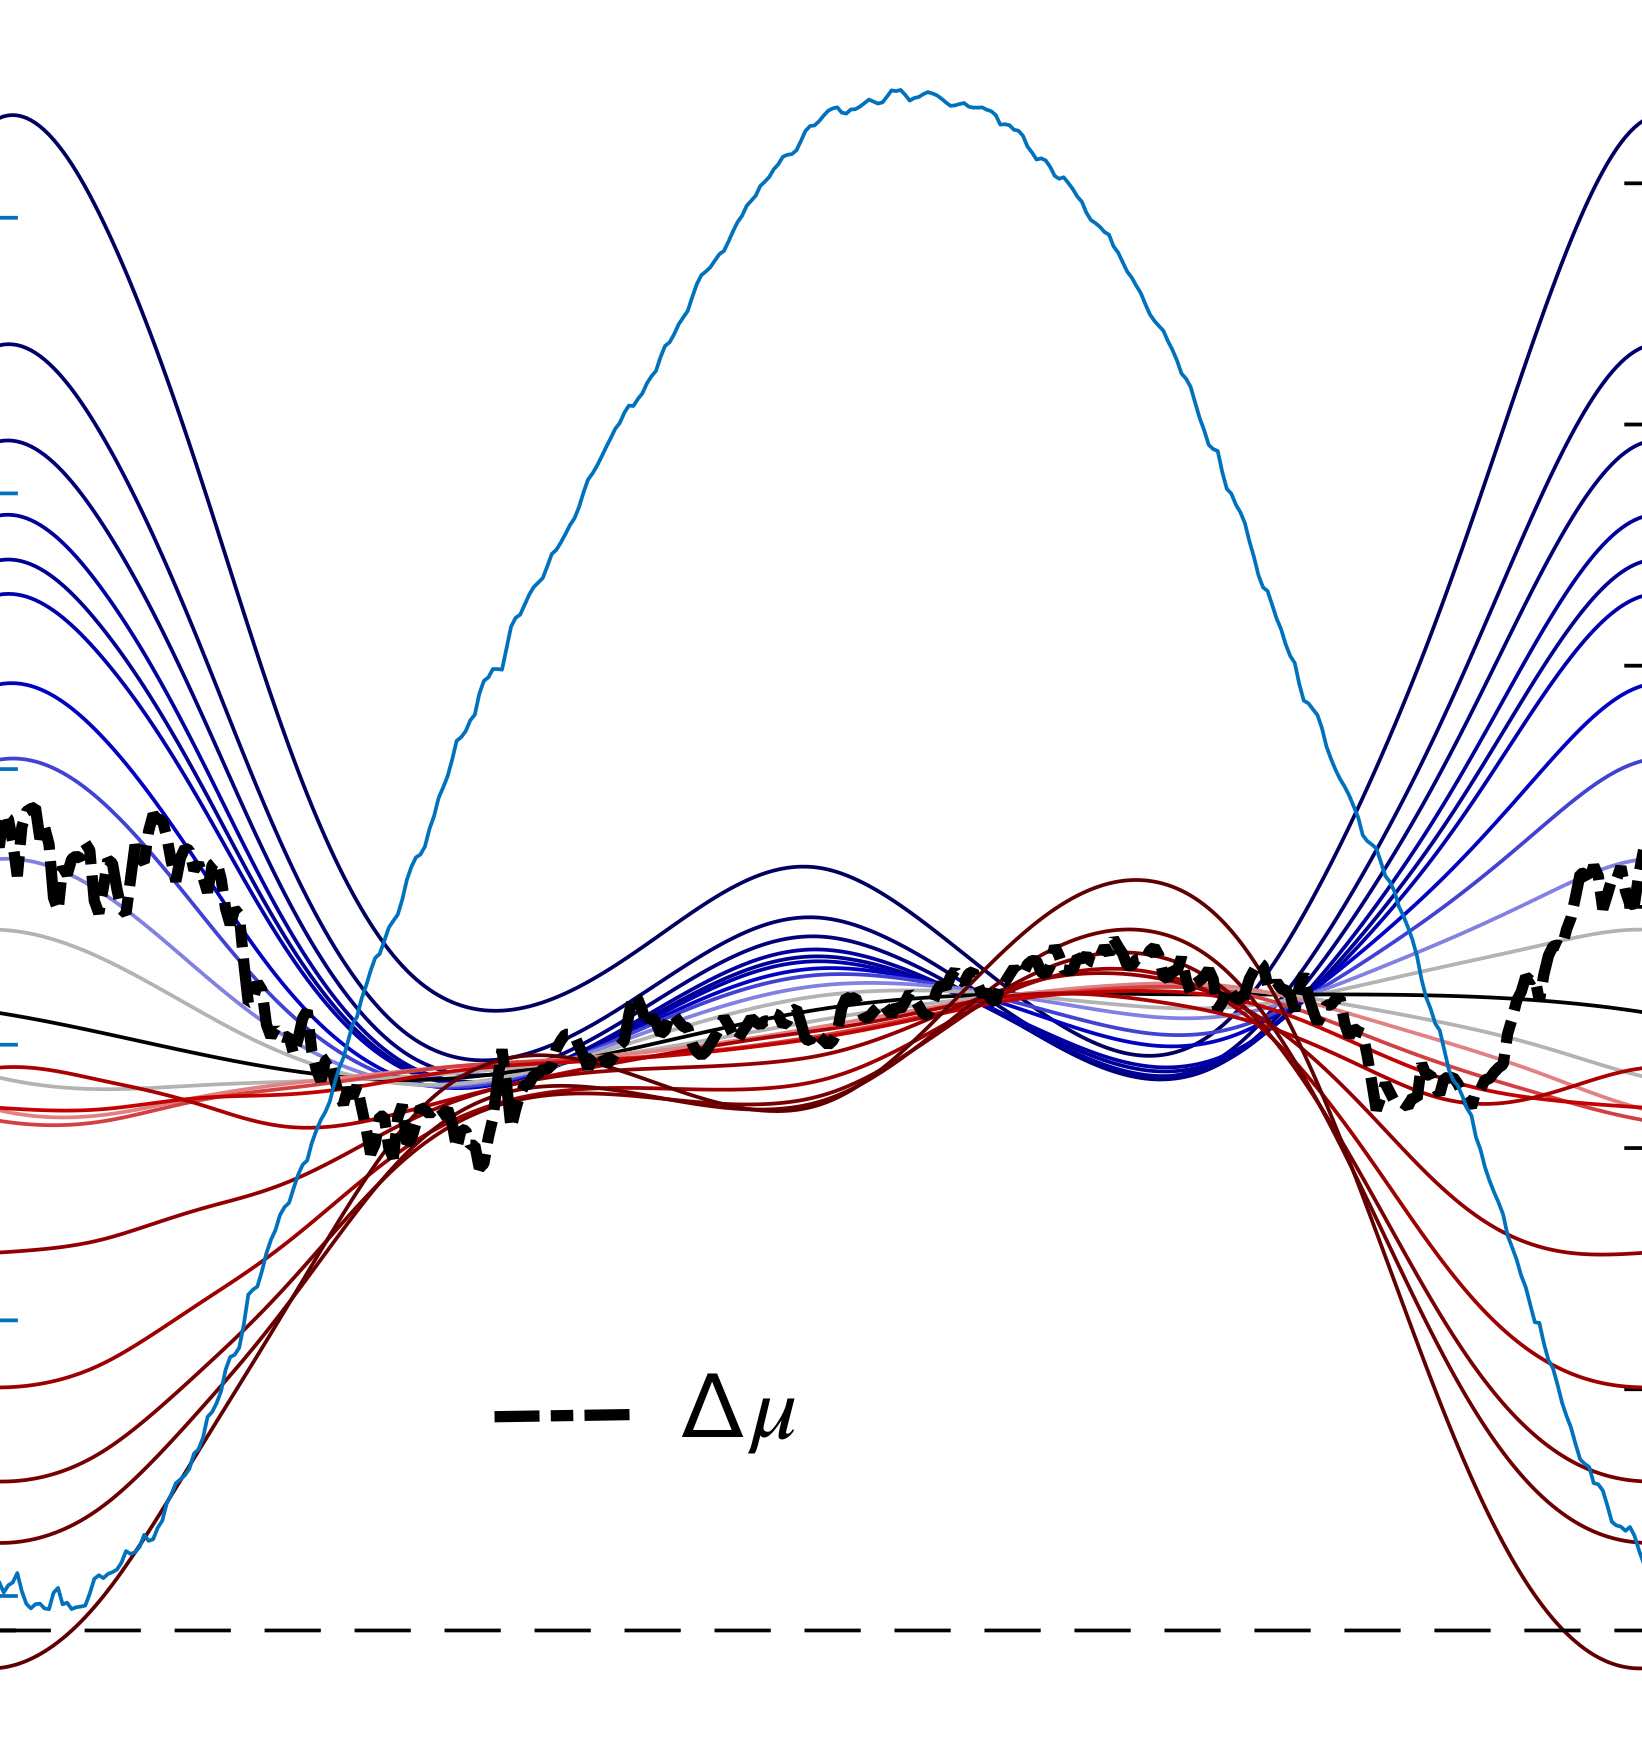
Chicago winters warm strongly in the 40-member LENS ensemble, seen in estimated changes in daily temperature distributions. Wintertime lows (blue lines) rise by up to 12 degrees by 2100. (Black dashed line = no change). (Schwarzwald et al. 2019)
The Center for Robust Decision-making on Climate and Energy Policy (RDCEP) brings together experts in climate science, statistics, computer science, economics, energy, public policy, and law to undertake a series of research programs aimed at improving the computational models needed to understand future climate impacts, evaluate policies, and make robust decisions based on outcomes.
While we’re all social distancing, our education team is moving our outreach classes online!


